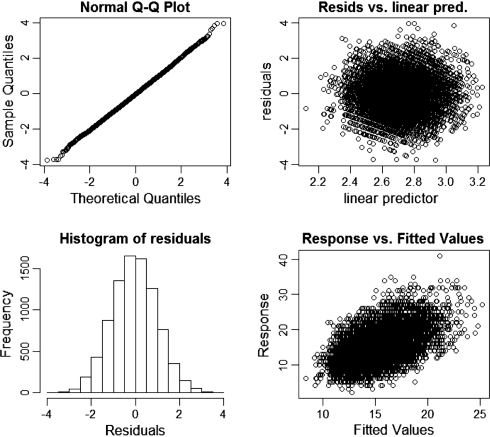
Fig. 2.
Basic residual plots for checking the generalized additive model (GAM) model fitting process (Kanto region). The upper left normal (Q-Q) plot is very close to a straight line, suggesting reasonable distributional assumption. The upper right plot suggests that variance is approximately constant as the mean increases. The histogram of residuals at the lower left appears consistent with normality. The lower right plot of response against fitted values shows a positive linear relation with a good deal of scatter: nothing problematic. Resids. residuals, pred. predictor, Q-Q Quantiles-Quantiles

