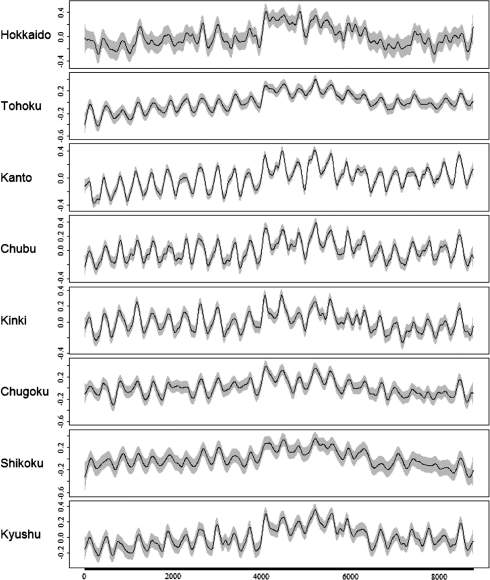
Fig. 4.
The GAM-estimated effect of time component on suicide mortality for 8 regions in Japan (excluding Okinwa) (1972–1995). The continuous lines are the function estimates, and the shaded areas delimit the 95% confidence interval for the function. The numbers on each y-axis are the effective degrees of freedom of the term being plotted. The numbers on the x-axis indicate days starting from January 1st, 1972. Smoothing parameters are estimated by unbiased risk estimation (UBRE)/Akaike information criterion (AIC) [36]

