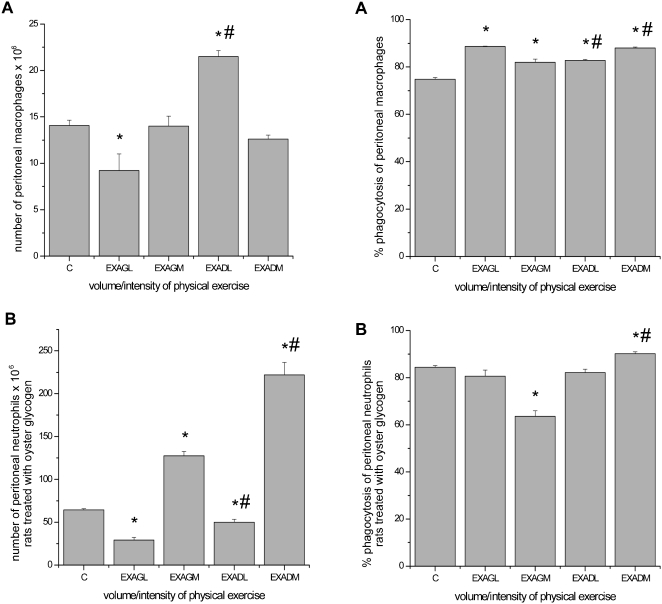
Figure 2.
Total number and phagocytic capacity of peritoneal macrophages and neutrophils. A, macrophage study. B, neutrophil study. The results are expressed as the average number of peritoneal macrophages and neutrophils and the percentage of phagocytosis ± standard error of the average. * p ≤ 0.05 for exercise groups submitted to low‐ and moderate‐intensity exercise (unadapted low intensity = EXAGL; moderate intensity = EXAGM and corresponding preadapted groups, EXADL and EXADM) as compared to the control group (C); # p ≤ 0.05 for comparisons made among the groups.

