
Fig. 2.
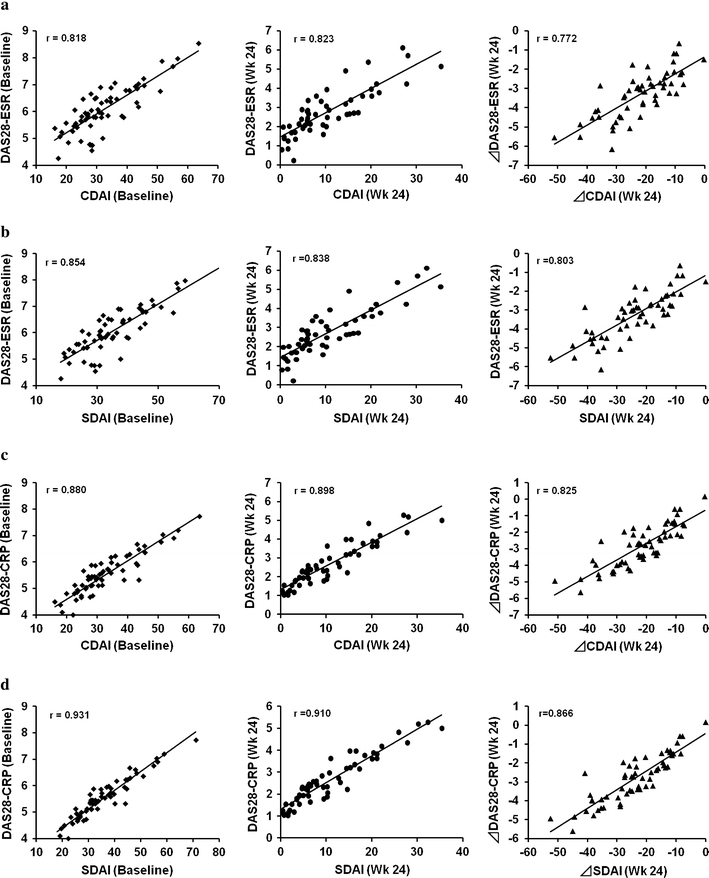
Scatter plots of DAS28-ESR/DAS28-CRP versus CDAI/SDAI at baseline and at week 24, and change in DAS28-ESR/DAS28-CRP versus change in CDAI/SDAI at week 24 in the TCZ group. The results of the 61 patients at baseline and the 53 patients who completed the 24-week study in the TCZ group are shown. All regression lines indicate a highly significant correlation between DAS28-ESR/DAS28-CRP and CDAI/SDAI. a DAS28-ESR vs. CDAI, b DAS28-ESR vs. SDAI, c DAS28-CRP vs. CDAI, d DAS28-CRP vs. SDAI