
Fig. 3.
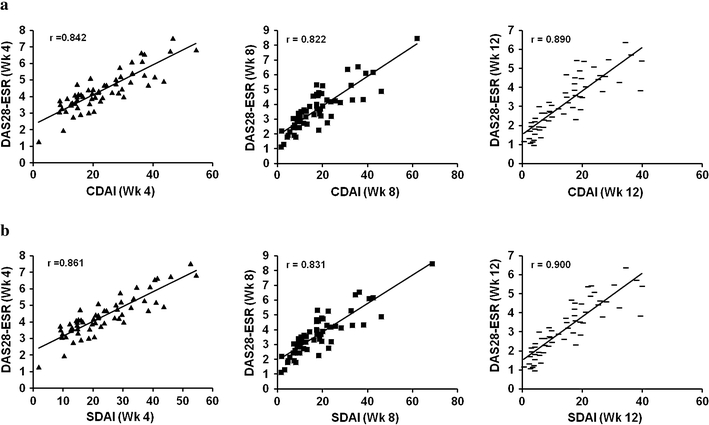
Scatter plots of DAS28-ESR versus CDAI/SDAI at weeks 4, 8, and 12 in the TCZ group. The results of 58 patients at week 4, 60 patients at week 8, and 59 patients at week 12 in the TCZ group are shown. The difference in patient numbers is due to missing ESR data. All regression lines indicate a highly significant correlation between DAS28-ESR and CDAI/SDAI. a DAS28-ESR vs. CDAI (week 4, 8, 12), b DAS28-ESR vs. SDAI (week 4, 8, 12)