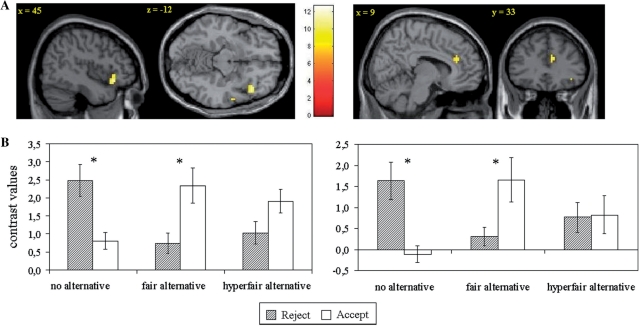
Fig. 3.
(A) Brain regions [right insula (on left; MNI (45, 24, −12)] and dorsal ACC [on right; MNI (9, 33, 24)] of significant interaction in the 2 × 3 full factorial design and (B) contrast values in these regions (right insula on left; dorsal ACC on right) for acceptance and rejection of unfair offers in the three conditions. Significant differences between brain activity for acceptance and rejection of unfair offers in each condition are indicated with an asterisk. (Results for left insula are not shown).

