
Figure 1.
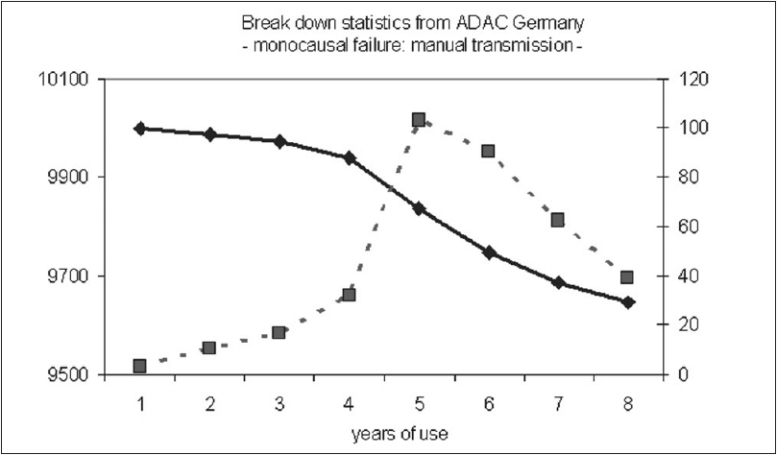
Statistical data from the general automobile club of Germany ADAC, depicting a mono-causal failure of manual transmission. The sshaped black curve is representing the age-related number of nondefective cars, whereas the cross lined curve illustrates the yearly failure of cars caused by a defective manual transmission with a peak incidence after 5 years (with courtesy of H. Schmaler, ADAC Munich, Germany).