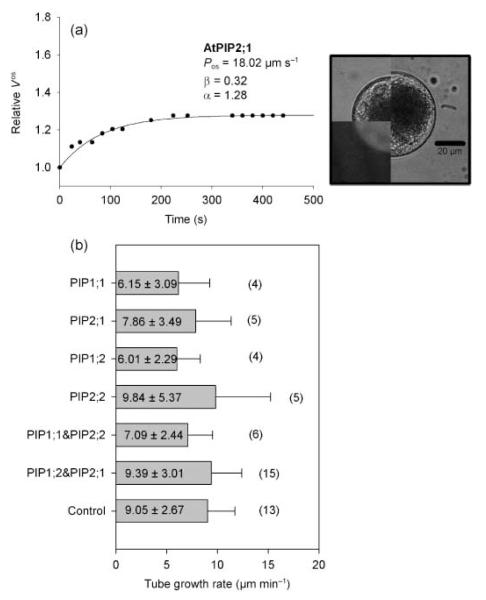
Fig. 6.
Typical swelling curve of a pollen tube protoplast transformed with Arabidopsis thaliana plasma membrane intrinsic protein 2;1 (AtPIP2;1) (a) and pollen tube growth rates measured in pollen tubes of control and transformed pollen grains (b). The images show the protoplast at t = 0 min as bright field images (upper left quarter) and as fluorescence images (lower left quarter). The right half of the image shows the protoplast at the end of the swelling curve (tfinal). Numbers in brackets give the number of individual experiments whereas the numbers in the boxes give the mean growth rate ± SD in μm min−1. Bar, 20 μm.

