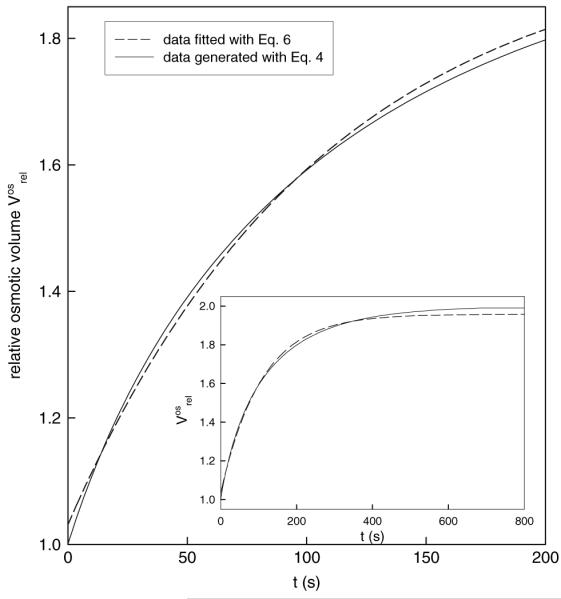
Fig. 1.

Single exponential functions do not describe adequately the osmotic swelling data. The plot shows the first 200 s from a simulated 800 s volume transient. The entire transient is shown in the inset. Continuous line represents data simulated with theoretical function (4), using a rate constant of k = 0.006 corresponding to Pos = 14.9 (μm · s−1; further parameters used were α = 2, D = 40 μm, cf = 300 mOsm. Dashed line represents the regression curve obtained by fitting the data points with a single exponential function (Eq. 6). The fit parameter K has the value 0.0093, which gives a Pos of 23.13 μm · s−1, according to relation (5). If the rate constant is defined as proposed by van Heeswijk & van Os (1986) as K = αk, then k takes the value 0.00465 and consequently Pos (calculated with relation 8) is 11.56 (μm · s−1)
