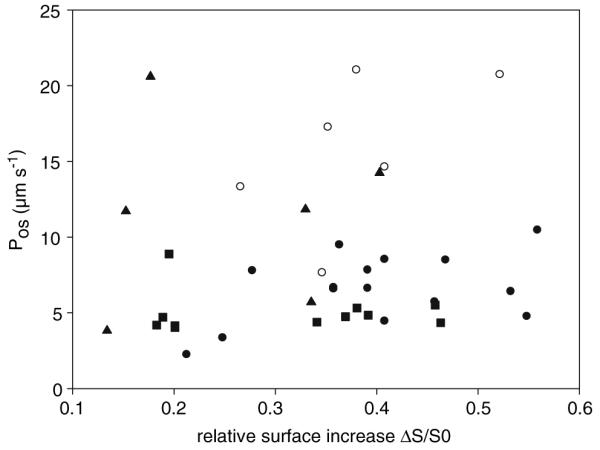
Fig. 4.

Scatter plot of individual Pos values of all four protoplast types were plotted against the respective relative surface increase. Each data point in the plot represents a single protoplast, with Pos and ΔS/S0 calculated from its volume transient. Pollen grain protoplasts (●), pollen tube protoplast (○), tobacco mesophyll cell protoplasts (▲) and Arabidopsis thaliana mesophyll cell protoplasts (■)
