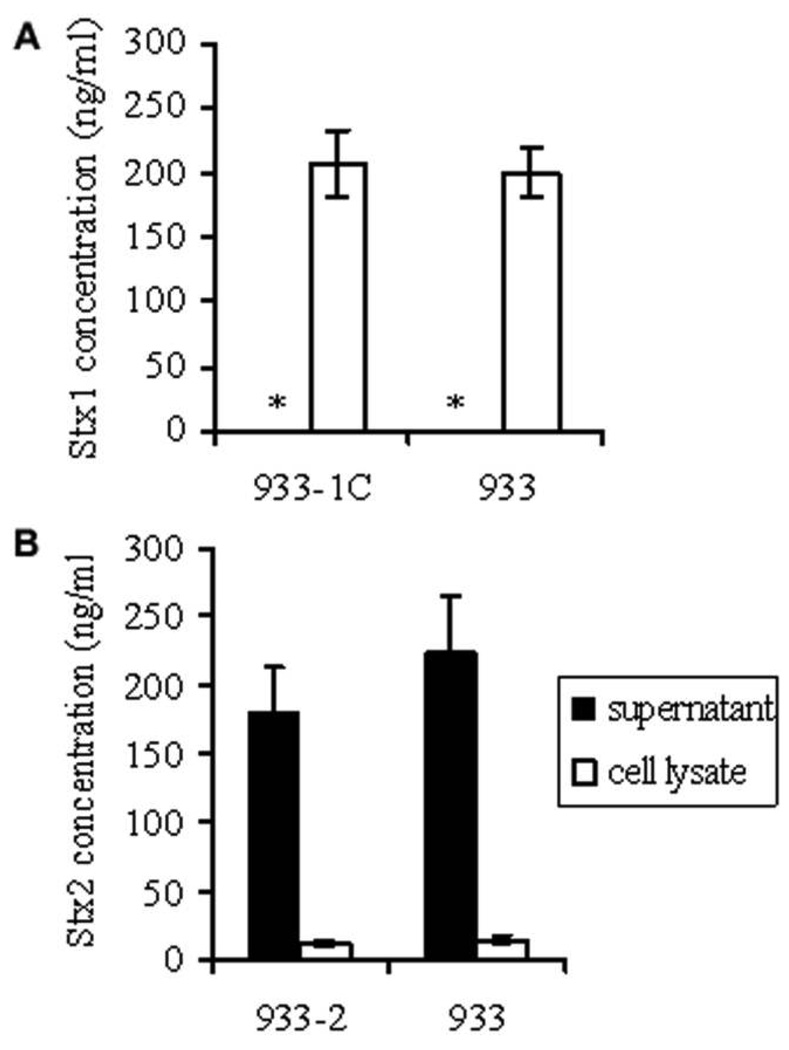
Figure 1.
Toxin levels in culture supernatants and cell lysates. A, Shiga toxin (Stx) 1–producing strains 933-1C and 933. B, Stx2-producing strains 933-2 and 933. Stx in supernatants or cell lysates was detected by ELISA, and the concentration was determined on the basis of standard curves using purified Stx1 or Stx2. Results are expressed as mean ± SE toxin concentrations for 10 different inocula for each strain. Student’s t test was used for related 2-group comparisons. * Stx1 concentration <1 ng/mL.

