Figure 5.

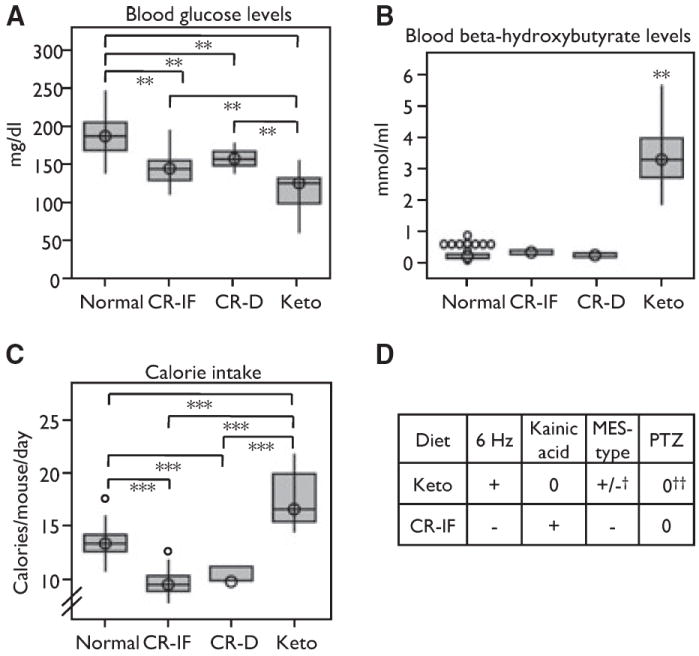
Low blood glucose does not correlate with seizure protection. (A) Boxplots showing blood glucose levels in all four diet groups (**p < 0.01). Results presented are for mice fed as described in Fig. 1 (Normal, n = 45 mice; CR-IF, n = 39; CR-D, n = 11; Keto, n = 25). (B) Boxplots showing blood β-hydrox-ybutyrate levels, ***p < 0.001 for all comparisons versus Keto (Normal, n = 44 mice; CR-IF, n = 39; CR-D, n = 11; Keto, n = 25). (C) Boxplot showing calories consumed per mouse based on food weight per each cage, uncorrected for weight (***p < 0.001) (Normal, n = 39 cages; CR-IF, n = 41 cages; CR-D, n = 11 cages; Keto, n = 28 cages). (D) Chart comparing seizure tests among different dietary regimens from this study, except as noted. [+, protective compared to Normal; −, more severe seizure phenotypes compared to Normal; 0, no effect; +/−, mixed results; †(Millichap et al., 1964; Uhlemann & Neims, 1972; Martillotti et al., 2006); ‡(Uhlemann & Neims, 1972; Samala et al., 2008)].
