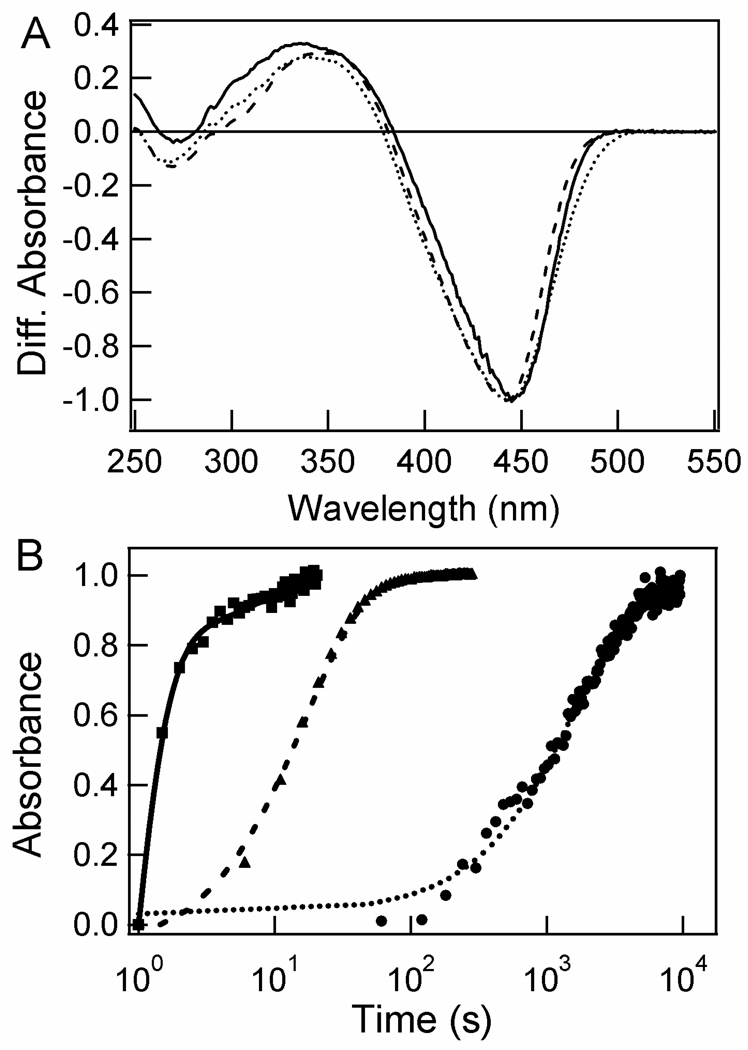
Figure 6.
Substitutions at Asn43 slow down the kinetics of the last PYP photocycle step. The pB-pG UV/vis absorbance difference spectra (A) and kinetics of the pB to pG transition (B) for wtPYP (solid lines and squares), N43S PYP (dashed lines and triangles), and N43A PYP (dotted lines and circles) at pH 7.1 are shown. The difference spectra were normalized for the extent of bleaching of the pG state. The kinetics of the wtPYP photocycle were fitted as a biexponential decay, those of N43A and N43S PYP as a monoexponential decay. The amplitudes of the kinetic traces were normalized; the optical densities of the samples at their visible absorbance maxima near 445 nm were in the 0.35 – 0.45 range.

