Figure 2.
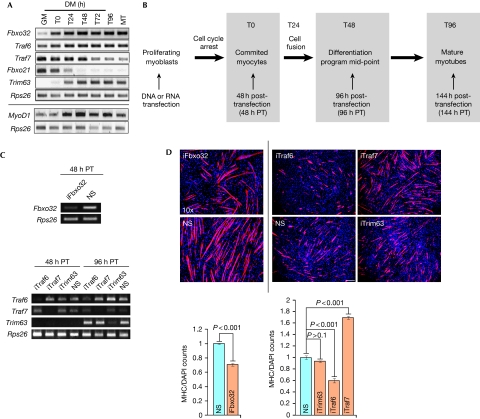
A distinct function for Traf7 in differentiation. (A) RT–PCR analysis of indicated E3 ligases (top) and MyoD1 (bottom). Rps26, input and loading control. GM and MT indicate growing myoblasts and myotubes, respectively. Cells are confluent at T0. T24–T96 indicate time (hours) in DM. (B) Diagram of experimental scheme. Transfections were performed in growing myoblasts at <50–60% confluence. (C) RT–PCR analysis of Fbxo32 (T0) and Traf6, Traf7 and Trim63 depletion at T0 (48 h PT) or T48 (96 h post-transfection). (D) Top panels show immunofluorescence on myoblasts depleted of Fbxo32 (left) or Traf6, Traf7 or Trim63 (right, independent experiment) and differentiated for 2 days. Scale bar, 40 μm, magnification × 10. Trim63, control; RNAi performed with pool of four siRNAs. Cells were stained with MHC antibodies (red) and DAPI (blue). Quantitation of data in top panel is also shown; MHC/DAP1 signal for each siRNA was normalized against NS. Error bars indicate s.e.m. values; P-values shown for n=5 independent experiments. DAPI, 4′,6-diamidino-2-phenylindole; DM, differentiation medium; MHC, myosin heavy chain; NS, nonspecific; PT, post-transfection; RNAi, RNA interference; RT–PCR, reverse transcriptase PCR.

