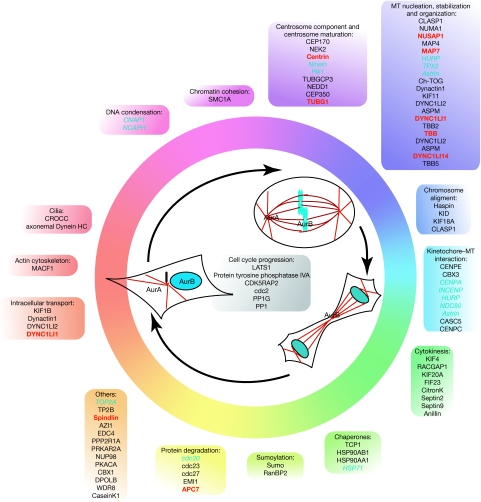
Figure 5.
Functional distribution of the predicted Aurora substrates. Known and candidate substrates classified according to their functions throughout the cell cycle. In the cell schemes, microtubules appear in red and DNA in blue. In the text boxes, blue, red and black indicate known, validated and proposed Aurora substrates, respectively.

