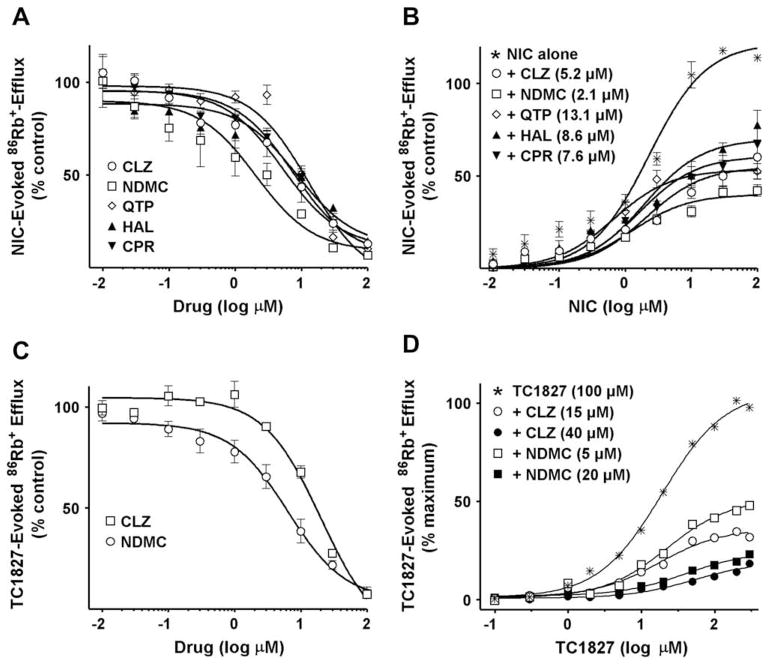
Fig. 1.
(A) Inhibition of nicotine (NIC)-evoked 86Rb+-efflux from α4β2/SH-EP1 cells by antipsychotics. Data are expressed as percent of control response evoked by 10 μM nicotine (Mean ± S.E.M. for 3–4 independent experiments). Curves were generated using nonlinear regression (individual data were best fitted to a one-site model) for clozapine (CLZ) (○), quetiapine (QTP) (◇), the clozapine metabolite N-desmethylclozapine(NDMC) (□), haloperidol (HAL) (▲) and chlorpromazine (CPR) (▼). (B) Insurmountable effect of antipsychotics at their IC50 concentrations on concentration–response relationship of nicotine for stimulation of 86Rb+-efflux from α4β2/SH-EP1 cells. Data are expressed as a percent of control response evoked by 10 μM nicotine (Mean ± S.E.M. of 3–4 independent experiments). Curves were generated using nonlinear regression (individual data were best fitted to a one-site model). (C) Inhibition of TC-1827-evoked 86Rb+-efflux from α4β2/SH-EP1 cells by clozapine (□) or N-desmethylclozapine (○). Data are expressed as percent of control response evoked by 100 μM TC-1827 (Means ± S.E.M. of 4 independent experiments). Curves were generated using nonlinear regression (individual data were best fitted to a one-site model). (D) Insurmountable effect of 15 μM (○) and 40 μM (●) clozapine, or 5 μM (□) and 20 μM (■) N-desmethylclozapine on the concentration–response relationship of TC-1827 for stimulation of 86Rb+-efflux from α4β2/SH-EP1 cells. Data expressed as a percent of control response evoked by 100 μM TC-1827 (Mean ± S.E.M. of 3 independent experiments). Curves were generated using nonlinear regression (individual data were best fitted to a one-site model).

