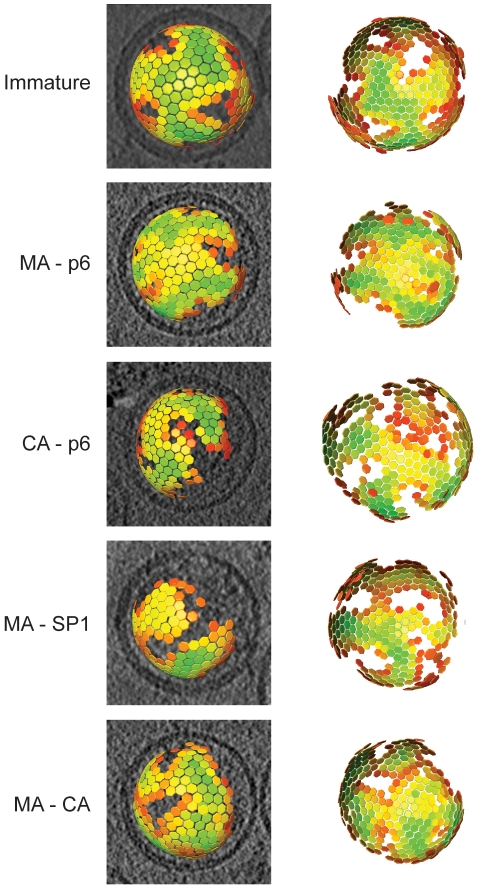
Figure 3. The global arrangement of the Gag layer.
Global lattice maps for each variant superimposed on central sections of the tomographic reconstruction of the virus (left panels), or viewed from the direction of the largest gap in the lattice (right panels). The centres of each hexameric unit cell are marked with hexamers, which are coloured according to cross correlation on a scale from low (red) to high (green). Higher cross correlation values indicate that the subtomogram is more similar to the average structure. The cross-correlation range in each map has been set between the minimum and the maximum cross-correlation value present in the map. Maps are shown in perspective such that hexamers on the rear surface of the particle appear smaller.

