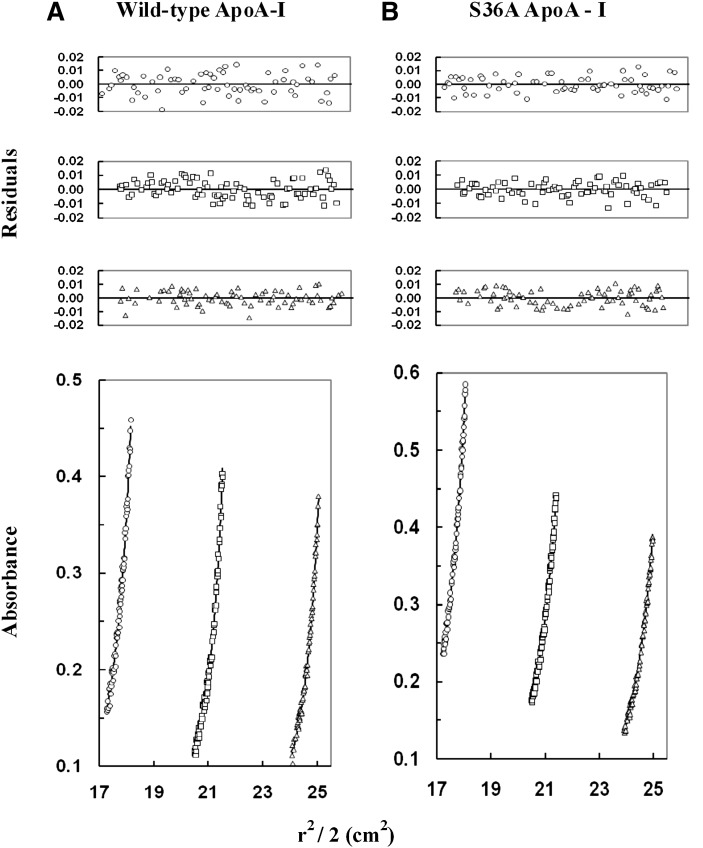
Fig. 8.
Sedimentation-equilibrium analysis of wild-type and mutant apoA-I. Wild-type apoA-I and S36A apoA-I were dissolved in 50 mM Tris (pH 7.0), 100 mM sodium chloride, and then centrifuged at 16,000, 18,000, and 20,000 rpm at 20°C (only the data collected at 16,000 rpm are shown). The protein concentration was 0.60 mg/ml (circles), 0.40 mg/ml (squares), or 0.30 mg/ml (triangles) for wild-type apoA-I (A) and for S36A ApoA-I (B). The lower graphs illustrate plots of r2/2 versus absorbance. The symbols represent measured data points, and solid lines represent best-fit curves to a monomer-tetramer model (A, B). The upper graphs illustrate the residuals from the fitting. The random, nonsystematic distribution of the residuals indicates a good fit of the data to the models. apoA-I, apolipoprotein A-I; WT, wild-type.

