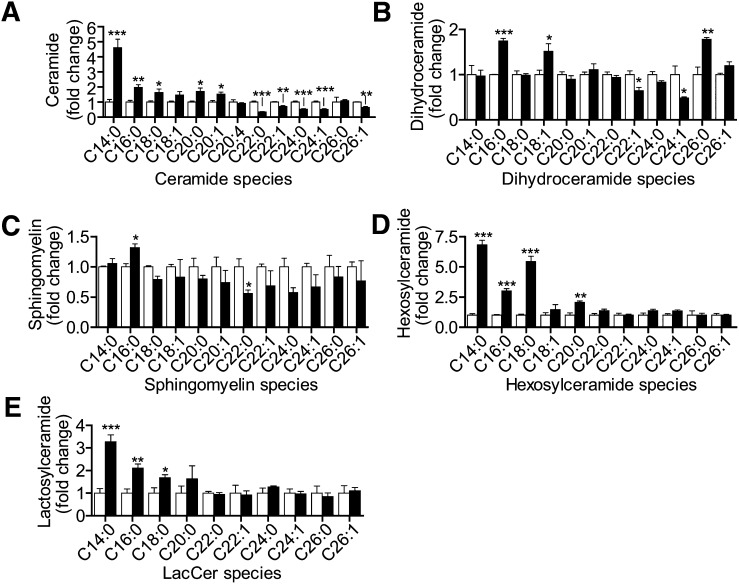
Fig. 4.
CerS2 downregulation results in a shift of sphingolipid distribution to predominantly long-chain species, resulting in the accumulation of C16:0-SM and long-chain glycosphingolipids. The effects of siCerS2 (black bars) on Cer (A), dHCer (B), SM (C), HexCer (D), and LacCer (E) compared with siControl (white bars) were determined as described in Fig. 4. Sphingolipid levels are normalized to the amount of total lipid phosphate. Data are means ± SEM for three to five independent experiments. *, P < 0.05; **, P < 0.01; ***, P < 0.01 versus siControl.

