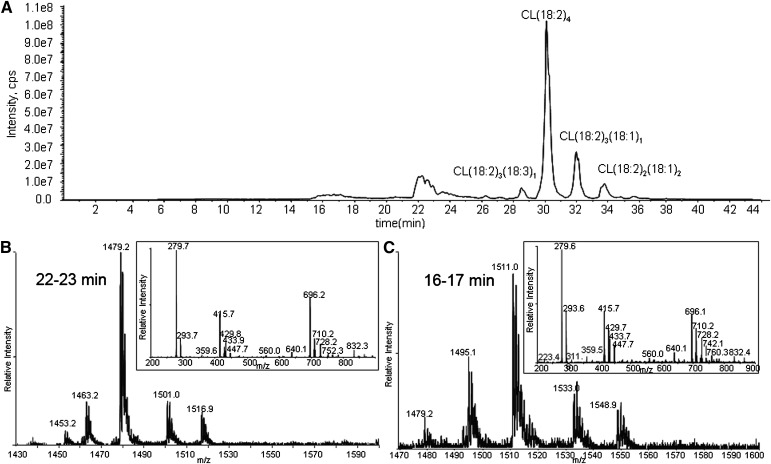
Fig. 7.
Total ion chromatogram of CL oxidized by 2,2′-azobis(2-methylpropionamidine) dihydrochloride-generated free radical (A), and MS and MS/MS spectra of peaks at 22–23 min (B) and 16–17 min (C). MS and MS/MS spectra of the peak at 22–23 min show that the major species present in this region have m/z 1479 (B), corresponding to CL with either one hydroperoxyl group or with one hydroxyl group. Two major species found in the peak at 16–17 min of the chromatogram by MS and MS/MS spectra have m/z 1511 and 1495 (C), corresponding to CL with two hydroperoxyl groups and with one hydroperoxyl and one hydroxyl group, respectively.

