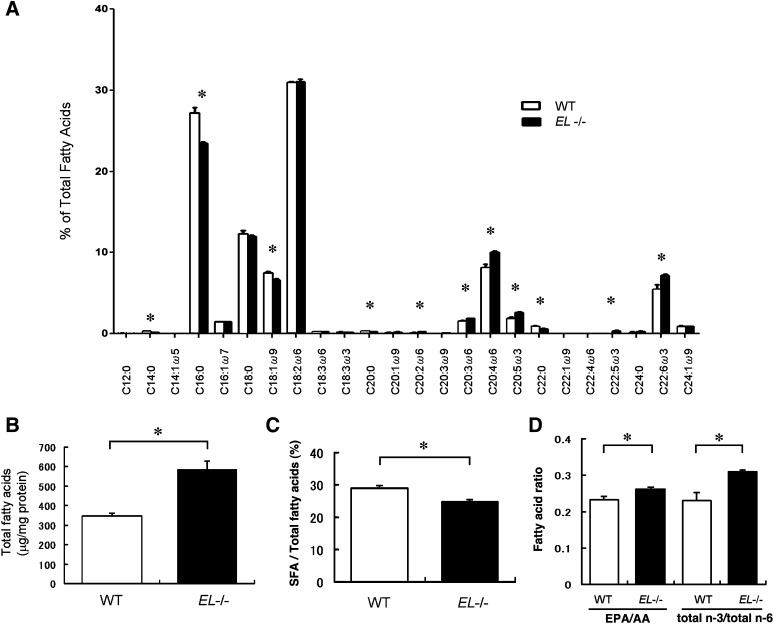
Fig. 3.
Analysis of fatty acids composition of isolated HDL. A: Fatty acid composition of isolated HDL was determined by GC-MS. B: Total fatty acids concentration in isolated HDL fractions was higher in HDL-EL−/− than in HDL-WT. C: Ratio of saturated fatty acids (SFA) and total fatty acids was lower in HDL-EL−/− than in HDL-WT. D: eicosapentaenoic acid (EPA)/ arachidonic acid (AA) and n-3/n-6 ratios were higher in HDL-EL−/− than in HDL-WT. Data were shown as mean ± SEM. * p < 0.05 versus WT (n = 6).

