Fig. 4.
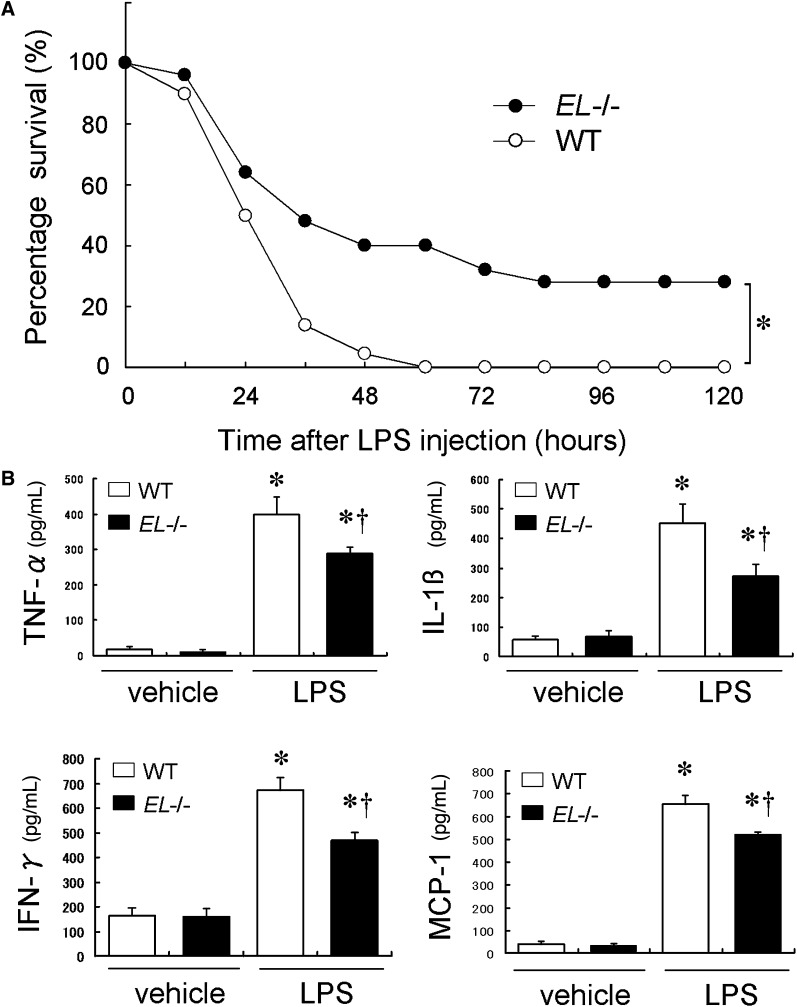
Effect of EL deficiency on LPS-induced mortality and cytokine release. A: Survival rate of WT and EL−/− mice in response to LPS (80 mg/kg). * p < 0.05 (n = 25 in each group). B: Plasma cytokine levels 2 h following the LPS or vehicle injection (40 mg/kg). These cytokine productions after LPS challenge were significantly attenuated in EL−/− mice compared with WT. Bars indicate mean ± SEM. * p < 0.05 versus baseline, † p < 0.05 versus corresponding WT (n = 5 in each group).

