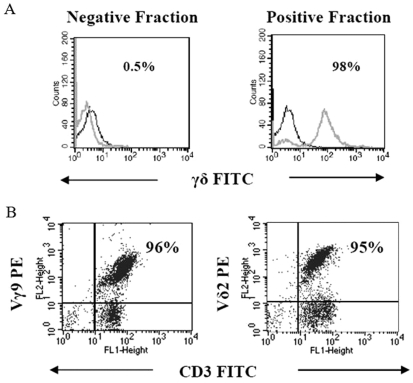
Figure 1.
Analysis of γδ T cells in the negative and positive fractions isolated by magnetic-activated cell sorting (MACS) using single color flow cytometry. (A) Each overlay represents γδ T cells stained with FITC-conjugated mAb against γδ TCR (grey) and FITC-conjugated mAb against isotype IgG (black) in negative and positive fractions. The positive fraction shows the presence of 98% γδ T cells. (B) Subset analysis of immunomagnetically purified γδ T cells by dual color flow cytometry. Purified γδ T cells were stained with fluorochrome (FITC or PE as indicated)-conjugated mAb against Vγ9, Vδ2 and CD3. The quadrants were established on the basis of staining of γδ T cells with IgG isotype control FITC- and PE-conjugated antibodies. Figures indicate the percentage of double positive cells.

