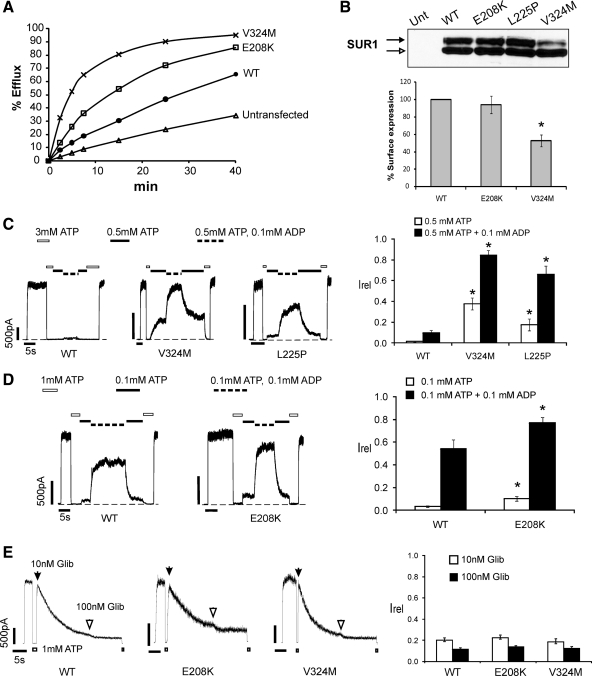
Figure 1.
Functional characterization of E208K- and V324M-SUR1 mutations. A, 86Rb+ efflux profile from COS cells transiently expressing WT or mutant channel subunits. Efflux was measured in Ringer’s solution without metabolic inhibitors. Both E208K and V324M exhibited higher efflux than WT, with the V324M mutant showing the highest activity, confirming that E208K- and V324M-SUR1 are activating KATP channel mutations. B, top, Western blot of SUR1 in COSm6 cells expressing Kir6.2 and WT or mutant SUR1. The empty arrow indicates the core-glycosylated immature band, and the solid arrow indicates the complex-glycosylated mature SUR1. The mature form of SUR1 is clearly reduced in V324M compared with WT, E208K, or L225P. Bottom, Quantification of surface expression of WT or mutant KATP channels using the chemiluminescence assay. Expression was normalized to that of WT channels. The expression level of V324M is significantly reduced compared with WT (n = 3; *, P < 0.05 by Student’s t test). C, Mg-nucleotide response was monitored by exposing channels to varying concentrations of ATP and ADP, with free [Mg2+] of approximately 1 mm. Representative recordings of WT, V324M, and L225P channels are shown. ATP and ADP concentrations are as indicated by the bars above the recordings. Bar graph shows quantification of currents relative to that seen in K-INT (140 mm KCl, 10 mm K-HEPES, 1 mm K-EGTA, pH 7.3) immediately after patch excision (n = 5–7; *, P < 0.05 by ANOVA with Dunnett’s post hoc test). D, Similar to panel C, except that the concentrations of ATP and ADP were different, and comparisons between WT and E208K were made. Bar graph is as in panel C (n = 5–7; *, P < 0.05 by Student’s t test). E, Channel sensitivity to glibenclamide (Glib). Shown are representative recordings of WT, E208K, and V324M channels in response to 10 or 100 nm glibenclamide. Because inhibition by glibenclamide is irreversible, channels were first exposed to 10 nm until the currents stabilized, followed by exposure to 100 nm glibenclamide. Bar graph shows quantification of near steady-state currents in 10 or 100 nm glibenclamide relative to currents in K-INT just before exposure to glibenclamide. Each bar is the mean ± sem of 7–10 patches. No statistical differences were observed between WT and the mutants.

