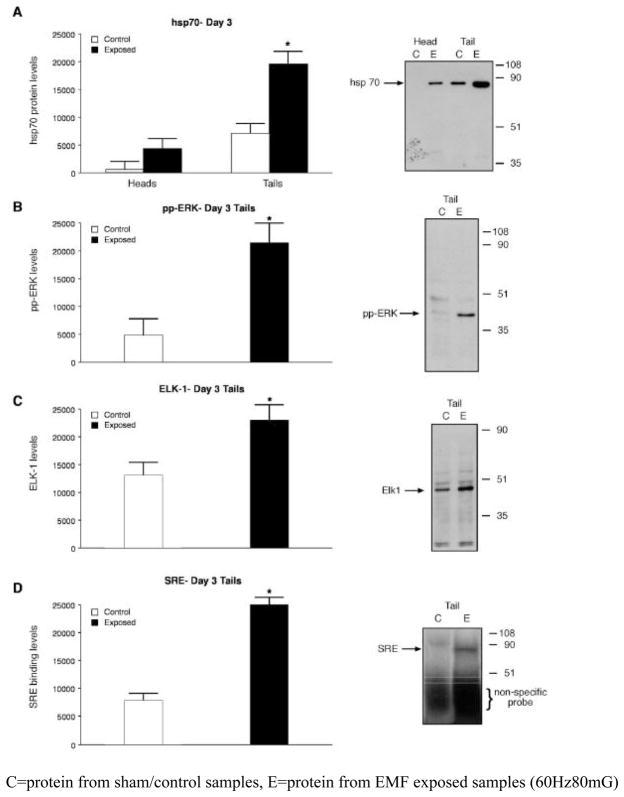
Figure 3. ELF-EMF activation of biochemical markers associated with injury and repair.
Hsp70, dual phosphorylated (activated) ERK, and Elk-1 were identified on Western blots and binding to a SRE was determined by EMSA. A representative image (one of three) is shown on the right of each panel. The images were scanned, the intensity of each band was determined and the mean intensity ± SEM was calculated and presented in a histogram. Statistically significant differences (p<0.05) between EMF-exposed and sham controls are indicated by asterisks.
A. Histogram showing a quantitative analysis of hsp70 protein levels from regenerating heads, tails, and sham controls. The relative protein levels are expressed in units based on the intensity of the protein on the Western blots.
B. Doubly phosphorylated ERKmapk: increased activation of the pp–ERK kinase in the ELF-EMF-exposed tail portions as compared with the sham exposed sample. The blot was probed with antibody that recognizes doubly phosphorylated (activated) ERKmapk (pp-ERK).
C. Electrophoretic mobility shift assay (EMSA). Phosphorylation of Elk1 was determined by measuring the transfer of 32P from 32P-ATP. Regenerating tail portion shows significantly greater Elk1 phosphorylation in the ELF-EMF - exposed tail portion than in the ELF-EMF- exposed head portion or control samples (data not shown).
D.Activation of SRE. Activation is initiated by a kinase cascade that leads to the dual phosphorylation of an ERK mapk. The mobility of this band corresponded to that of an Elk1 SRE transcription complex. [Mean quantitative differences in band density between exposed and sham exposed samples, for hsp70, ERK, Elk-1 and SRE, were assessed using 2-sample t-tests. n=3; asterisk denotes statistical significance p<0.05.].
Note: Analyses of EMF-induced hsp70 levels in the regenerating heads and tails were performed on day three (Figure 3A). The influence of ELF-EMF on molecular pathways in the regenerating tails was performed on day three post-transection (Figure 3B, C and D) coinciding with the time of maximal ELF-EMF-stimulated growth of the tail. C=protein from sham/control samples, E=protein from EMF exposed samples (60Hz80mG)

