
Figure 3. Crystal structure of the designed enzyme–DNA complex.
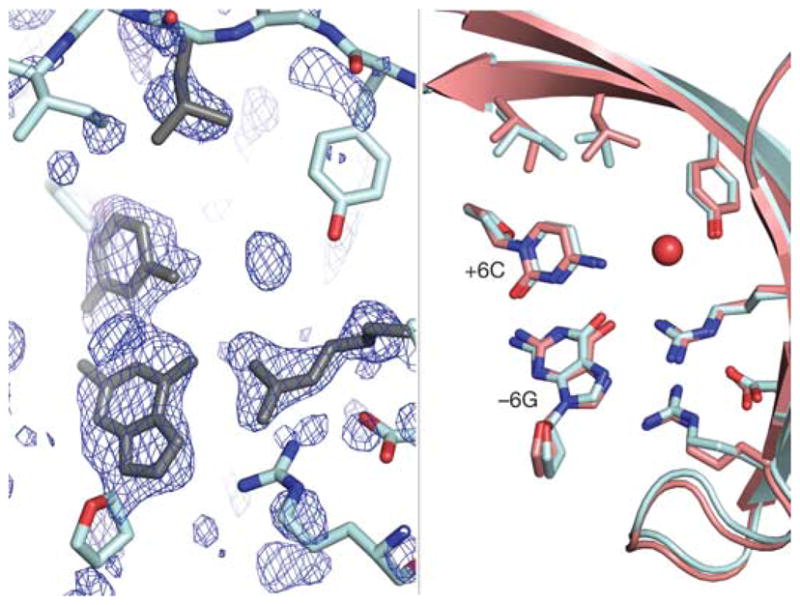
Left, Fo−Fc electron-density map of the redesigned region calculated from a refinement model lacking the redesigned side chains and bases (cyan). The computational design model (grey) fits well into the unassigned density (blue mesh, +2.2σ). Right, superposition of the design model (salmon) and the refined crystal structure (cyan) confirms the accuracy of the design. A new coordinated water molecule (red sphere) is also apparent.