
Figure 4.
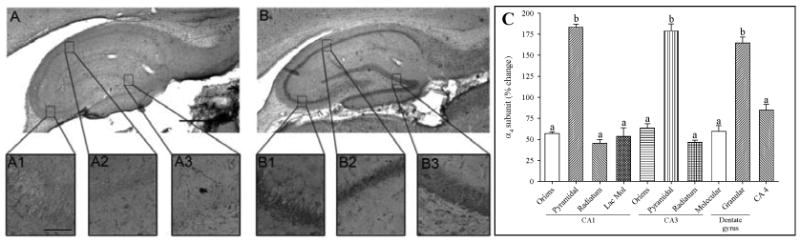
Changes in immunoreactivity for the α4 subunit of the GABAA receptor in the hippocampal formation induced by social isolation. (A, B) Representative immunohistochemical analysis of the distribution of the α4 subunit in hippocampal slices from group-housed or isolated rats, respectively. Scale bar, 1 mm. Insets (A1–A3, B1–B3) show α4 subunit immunoreactivity in the pyramidal cell layer of CA3, the pyramidal cell layer of CA1, and the granule cell layer of the dentate gyrus, respectively. Scale bar, 50 μm. (C) Quantitation of α4 subunit immunoreactivity in the indicated regions of the hippocampus. Data are expressed as percentage change in gray intensity for isolated rats relative to the corresponding value for group-housed rats and are means ± SEM of values from six animals for each experimental group. aP < 0.05, bP < 0.001 versus the corresponding value for group-housed rats (ANOVA followed by Scheffè's post hoc test). Reproduced with permission from Serra et al. (2006)