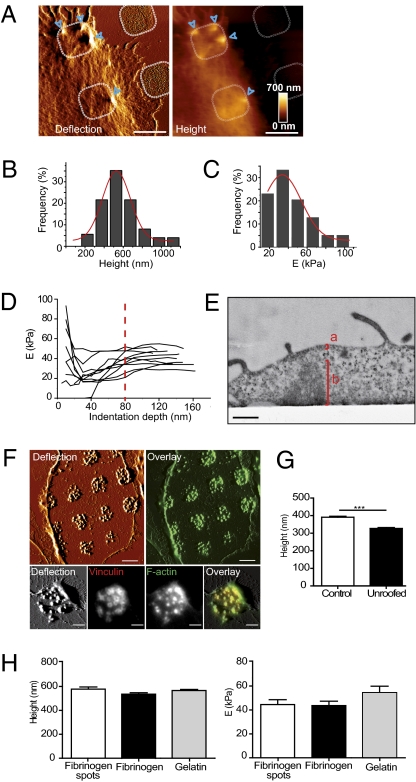
Fig. 2.
Biophysical properties of podosomes in living macrophages. (A) AFM deflection and topographical images of podosomes on fibrinogen spots. Dotted lines delineate fibrinogen spots underneath the cell, and blue arrowheads show podosomes. (Scale bars, 5 μm.) (B) Podosome height values from AFM topographical images of living macrophages on micropatterned fibrinogen exhibited a Gaussian distribution (red curve), with a mean of 578 ± 209 nm (n = 125 podosomes in 19 cells from seven donors). (C) The distribution of Young's modulus values was Gaussian (red curve), with a mean of 43.8 ± 9.3 kPa (n = 39 podosomes in 17 cells from four donors). (D) Young's modulus vs. indentation depth of podosomes. Representative curves of different podosomes are displayed (n = 10 podosomes in 10 cells from five donors). Dashed line shows the average indentation depth above which the Young's modulus reaches a plateau. (E) Transmission electron micrograph of a podosome at the cell periphery: a, dorsal membrane and cortical actin; b, podosome core. (Scale bar, 500 nm.) (F) Upper: AFM deflection of an unroofed macrophage plated on fibrinogen spots (Left) and overlay of AFM deflection combined to fluorescence image (Right). Lower: Correlative microscopy of AFM deflection and fluorescence images of F-actin and vinculin of an unroofed macrophage. (Scale bars, 2 μm.) (G) Quantification of podosome height of control and unroofed macrophages; mean values are 392.5 ± 110 nm and 328 ± 94 nm, respectively. Measurements were performed on at least 392 podosomes in 26 cells from at least four donors for each condition. (H) Height and Young's modulus podosomes in macrophages plated for 2 h on fibrinogen spots or nonpatterned gelatin and fibrinogen. Height and Young's modulus were measured on at least 125 podosomes in eight cells and on 17 podosomes in four cells, respectively, from at least two donors for each condition. One-way ANOVA shows that variance is not significant over the tested conditions.

