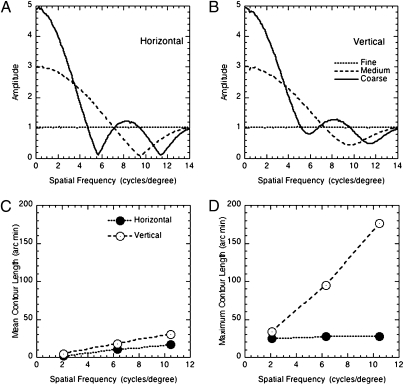
Fig. 4.
Fourier amplitude spectra for (A) horizontal and (B) vertical components for the texture-grating stimuli with the three cell sizes used in the experiment. (C) Mean and (D) maximum length of horizontal and vertical contours, as a function of cell size. All results are based on 10,000-example stimuli.

