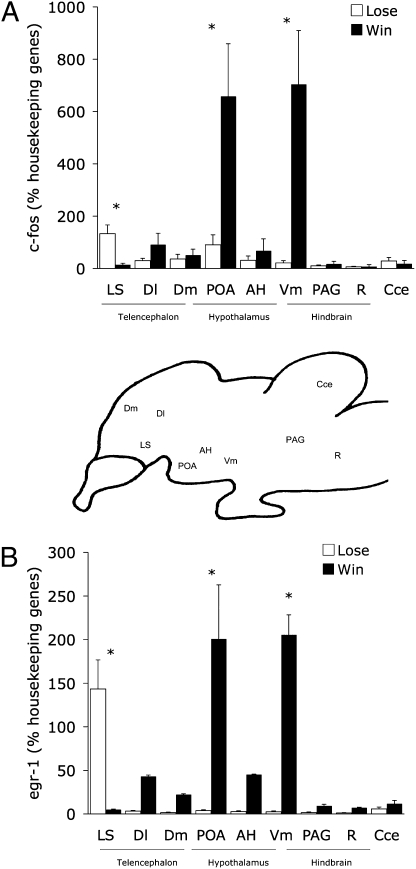
Fig. 2.
Mean (+SE) of relative gene expression of (A) c-fos and (B) egr-1 for each of the six nodes of the social behavior network, plotted as a function of whether females saw their preferred males win (filled bars) or lose (open bars) a fight. Asterisks above pairs of mean values indicate significant differences (t tests, corrected for multiple comparisons). Between panels A and B is a schematic sagittal section of the A. burtoni brain showing the approximate locations of the brain regions sampled. Cce, cerebellum; R, Raphe nucleus. As described in the text, all these brain regions are interconnected, sensitive to steroid hormones, and show high densities of androgen receptors (12, 13).

