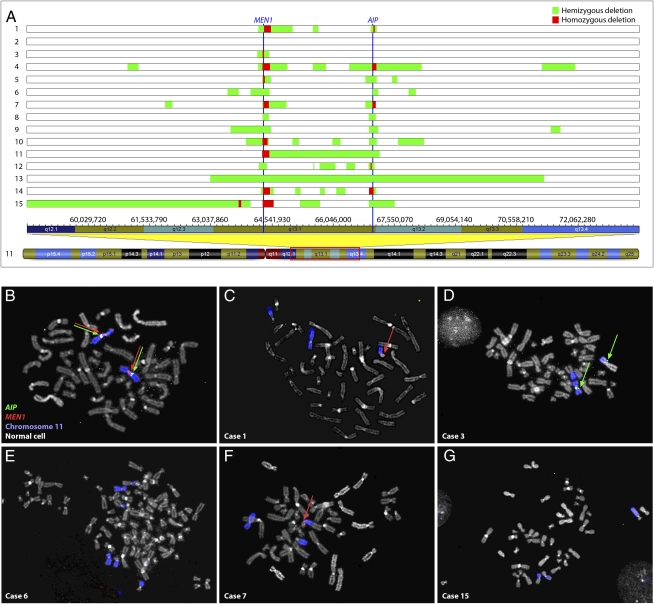
Fig. 1.
Genomic losses in hibernoma detected by SNP array and FISH analyses. (A) Global DNA copy numbers were evaluated by SNP array analysis and all cases with an aberrant SNP array profile displayed deletions in 11q13. In case 2, the genomic profile was normal. The vertical blue lines represent the MEN1 and AIP genes. Eight tumors showed homozygous deletion of MEN1 and three showed homozygous loss of AIP. The remaining cases demonstrated hemizygous deletion of MEN1 and all but one showed hemizygous loss of AIP. The genomic positions of all alterations are available in Table S2 and the aberrations affecting MEN1 and AIP are presented in detail in Fig. S2. Fluorescence in situ hybridization analysis with fosmid probes covering MEN1 and AIP was used to detect deletions in tumor cells, identified by rearrangements of chromosome 11. (B) As controls, signals from the probes were readily observed in normal cells from the same cases. (C) In case 1, homozygous loss of AIP and hemizygous deletion of MEN1 were detected, (D) case 3 showed homozygous loss of MEN1, (E) case 6 displayed homozygous deletions of both genes, (F) case 7 showed hemizygous deletion of MEN1 and homozygous loss of AIP, and (G) in case 15 both genes were homozygously deleted. The discrepancies between the SNP array and FISH analyses can be explained by differences in resolution of the techniques as well as normal cell contamination.

