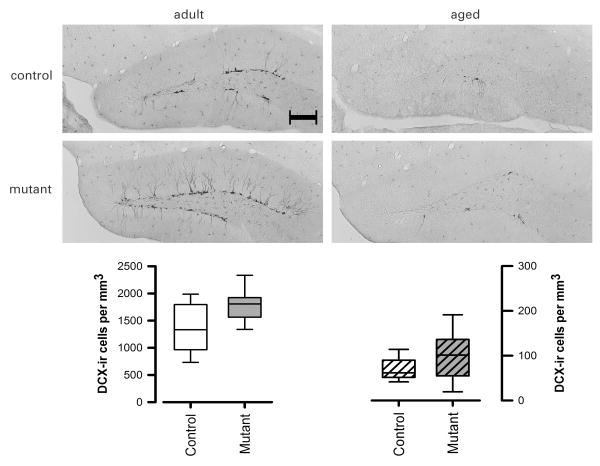
Figure 6.
Representative photomicrographs of doublecortin-positive (DCX) immunostaining (scale bar = 200 μm). Separate box-plots showing the stereological estimates of DCX-positive cells per unit volume in the dentate gyrus granule cell layers. Each box plot captures the data within the inter-quartile range in the box. The group median is represented by the horizontal line inside each box. The upper and lower whiskers represent the boundaries of the largest and lowest values within each group. All data refers to the original untransformed data set, and their depiction is appropriate for the non-parametric (Genotype × Age) ANOVA performed, which yielded a significant main effect of Genotype and of Age.

