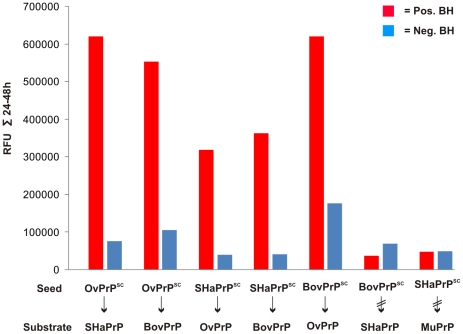
Figure 3. Comparison of different interspecies recPrP seeding.
Amyloid formation in the seeding assay was monitored using Thioflavin T. The fluorescence signals were recorded every 30 min at 37°C at recPrP amyloid forming conditions. Fluorescence intensities were summarized from 24–48 h (saturation phase). (Left to right) Interspecies transmission: OvPrPSc in SHaPrP(90–231); OvPrPSc in BovPrP(25–241); SHaPrPSc in OvPrP(25–233); SHaPrPSc in BovPrP(25–241); BovPrPSc in OvPrP(25–233). Interspecies barrier: BovPrPSc in SHaPrP(90–231); SHaPrPSc in MuPrP(89–231). As control parallel an approach was made with the corresponding intraspecies transmission (data not shown).

