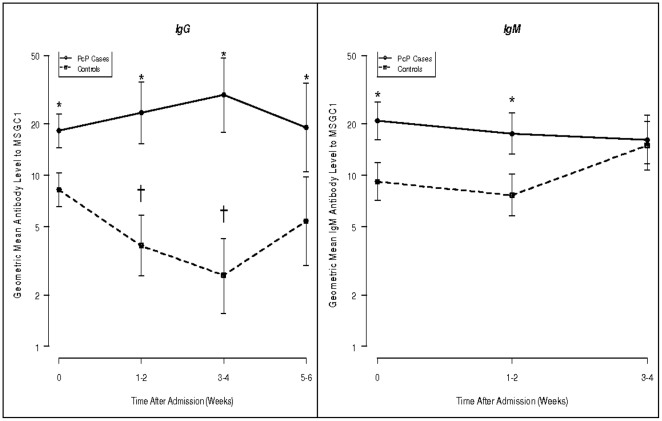
Figure 1. Geometric mean [95% CI] IgG and IgM antibody levels to MsgC1 in cases and controls over time.
*p<0.05 tests the differences in mean values between cases and controls at each time point. † tests in controls only the differences in mean values at week 1–2 compared to baseline and at week 3–4 compared to baseline. These comparisons in cases were not significant. A mixed effect Tobit regression model was written which provided an estimate of the average effect of PcP+ compared to PcP− in each interval. A random effect subject effect was modeled to account for correlation between measurements on the same subject in the same interval. The value of the t-statistics, testing Ho: PcP parameter estimate = 0, was used to judge the statistical significance of the effect of PcP+, compared to PcP−.

