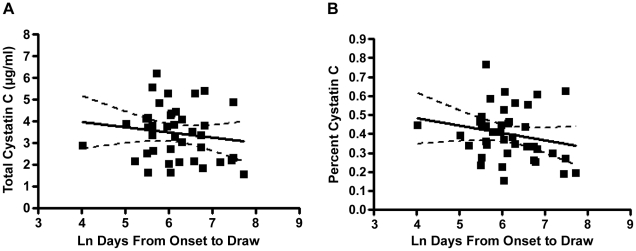
Figure 1. Linear regressions for CSF cystatin C levels vs. time from symptom onset.
The slope of the best-fit lines (solid) for both total (A) and percent (B) cystatin C did not significantly differ from zero (p = 0.368 and p = 0.193, respectively). Dashed line = 95% confidence interval for best-fit line.

