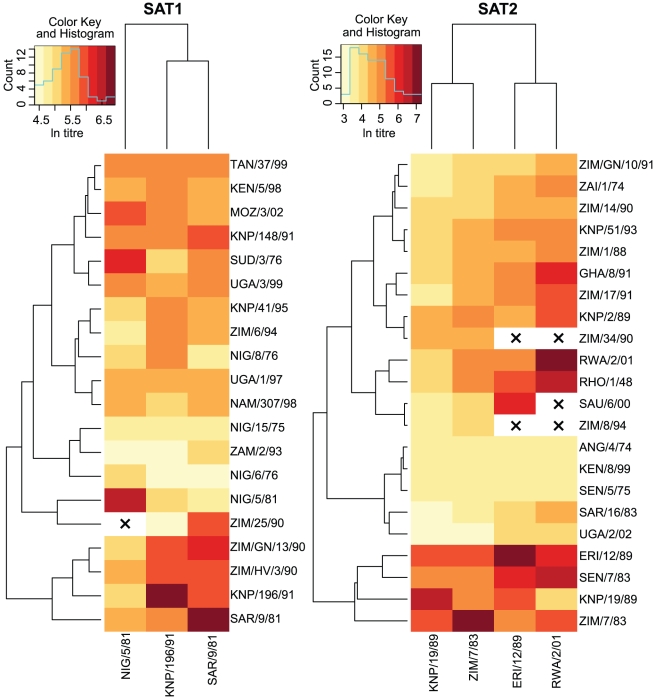
Figure 1. Heatmap and clustering analysis of virus neutralisation titres.
Two-dimensional hierarchical clustering of viruses and antisera for SAT1 (left) and SAT2 (right). Viruses were clustered according to their neutralization profiles along the vertical axis. Simultaneously, the antisera were arranged according to their abilities to neutralise the panel of viruses along the horizontal axis. Dendrogram patterns are shown to the left (for viruses) and top (for antisera). The color key for neutralization data points is shown in the histogram in the top left of each plot along with the count of viruses with each titre.×indicates the absence of data.

