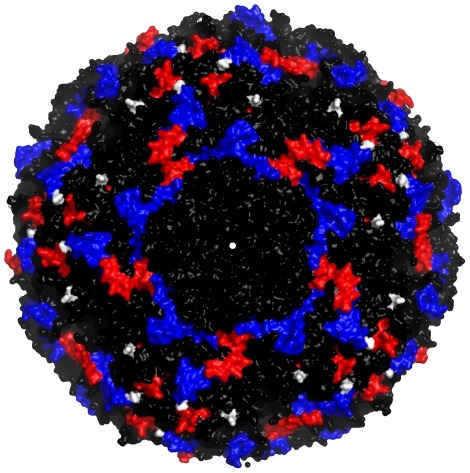
Figure 2. Antigenically significant areas of the SAT1 and SAT2 capsids.
The image shows the area around one of the five-fold axes of symmetry of the capsid (centre). Changes to blue areas were used as predictors of loss of cross-reactivity for SAT1, while changes to red areas were used for SAT2. The two residues identified as parts of an epitope – residue 138 on the VP3 E-F loop and residue 198 on the VP2 H-I loop – are coloured white. Note that these two residues and the other areas are repeated multiple times in the image due to structural symmetries in the capsid.

