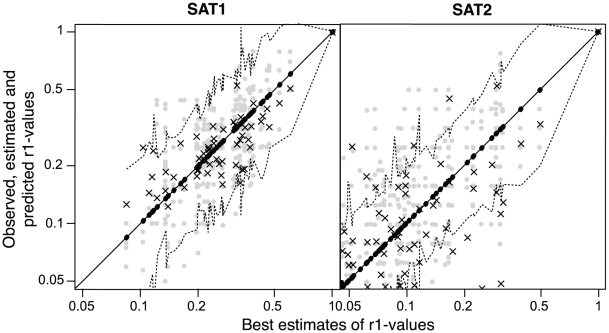
Figure 4. Predicting cross-reactivity using sequence data.
Bootstrap samples of individual serological r1-values (grey dots), predictions (black crosses) and matching best consensus estimates – our gold standard – and their confidence limits (black dots and dotted lines) against best consensus estimates for SAT1 and SAT2 r1-values. Because of the log-normally distributed variance structure of the r1-values, data are plotted on a log scale.

