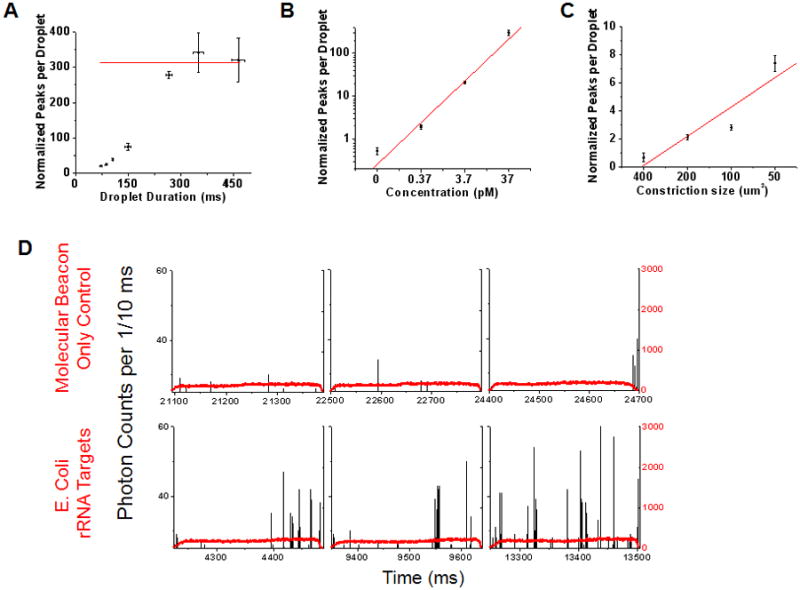
Fig 3.

A. Data showing the effect of droplet transit time on the mass detection efficiency within droplets. The data was obtained using a microfluidic chip (Fig 1C) with a 200 μm2 constriction. The discrete phase consisted of 1 μM TOTO-3, 37 pM Lambda DNA and 100 nM Alexa 488 dye. The number of single molecule fluorescent bursts increase with increasing droplet transit time through the microfluidic constriction, finally reaching a plateau (average value of 312 ± 31.9; red line) at transit times >280 ms. B. SMD-droplet platform response to changing molecular concentrations. Droplets were generated using discrete phase consisting of a range of DNA concentrations and passed through a 200 μm2 constriction for single molecule detection. (Solid line: weighted linear regression, R = 0.989) C. Manipulation of mass detection efficiency within droplets by simply changing the constriction size is demonstrated. As the constriction size decreases, larger sections of each droplet pass through the illumination volume and hence, mass detection efficiency increases. (Solid line: linear regression, R = 0.928) All the experiments were conducted on a CICS setup with detection volume cross section size 64.6 μm2 and DNA concentrations of 0.37 pM (details of data normalization in S4, ESI). D. The tunable nature of the droplet-CICS platform to attain single fluorophore sensitivity is illustrated using a Cy5 molecular beacon complementary to a sequence on 16S rRNA from E coli. The top row shows three representative sample droplets from a ‘molecular beacon (MB) only’ control sample. The black trace shows single molecule data from the Cy5 dye on the MBs. The bottom row shows sample droplets made from the same concentration molecular beacon hybridized with a synthetic target DNA. The average number of single molecule bursts per droplet in the control sample was 0.282 ± 0.11, compared to 9.075 ± 0.76 in the target sample. This experiment was conducted on a chip with a constriction cross sectional area of 200 μm2 and CICS illumination volume of 14.3 μm2. Each data point represents the interpolated y-intercept at zero threshold values from three sets of experiments with standard deviation; see details of single molecule analysis and thresholding in S4, ESI.
