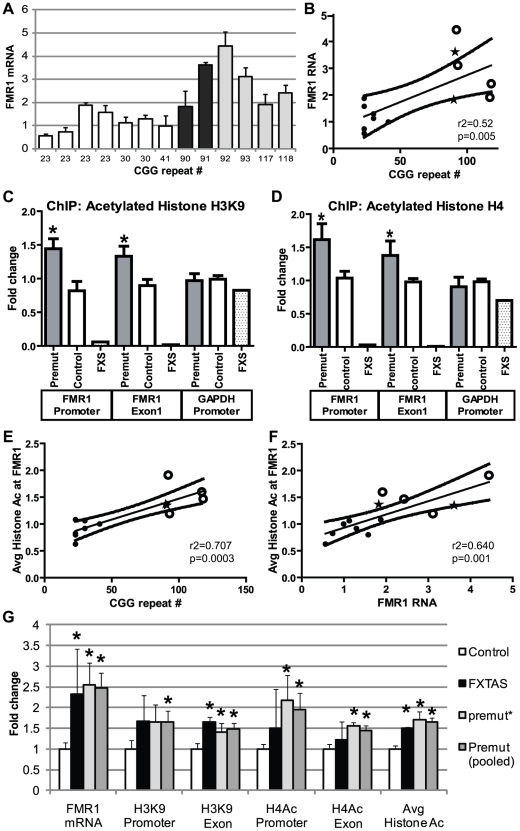
Figure 4. Chromatin alterations at FMR1 locus in pre-mutation expansion carrier lymphoblasts.
A) FMR1 mRNA expression by qRT-PCR from 13 lymphoblastoid cell lines derived from male patients in fragile X families. FMR1 mRNA levels, normalized to actin mRNA, are expressed relative to a control cell line included in all experiments ((CGG)41). White bars = control cell lines. Black bars = confirmed FXTAS cases. Light grey bars = pre-mutation carriers whose clinical status is unknown. B) Correlation between CGG repeat size and FMR1 mRNA. Solid black dots = control cell lines, stars = confirmed FXTAS cases, open circles = pre-mutation carriers whose clinical status is unknown. The central line is the linear best fit. Curved dashed lines are 95% confidence intervals. The correlation is significant (Spearman correlation r2 = 0.515, p = 0.005). C) ChIP against acetylated Histone H3K9 from all pre-mutation carriers (FXTAS and unknown clinical status, dark gray bars), controls (white bars), or FXS (spotted bars, 1 cell line) patient-derived cell lines. PCR primers were targeted to the FMR1 promoter, the first exon of FMR1, or the GAPDH promoter as a control. D) ChIP against acetylated Histone H4. For (C) and (D), ChIP DNA expression is normalized to input DNA and then graphed as fold change from a control cell line included in all experiments. E) Correlation between CGG repeat length and H3/H4 acetylation status. Repeat length plotted against mean fold change for association of the FMR1 locus with H3K9 or H4 acetylated histones. A combination of both markers at both the promoter and exon provided the best fit model. F) Correlation between H3/H4 histone acetylation and FMR1 mRNA levels. G) Comparison of confirmed FXTAS cases (black bars, n = 2) and pre-mutation lines whose clinical status is unknown (light grey bars, n = 4) with controls (white bars, n = 7). Dark grey bars = Pooled data on all pre-mutation lines (n = 6). * = P<0.05 t-test vs controls.

