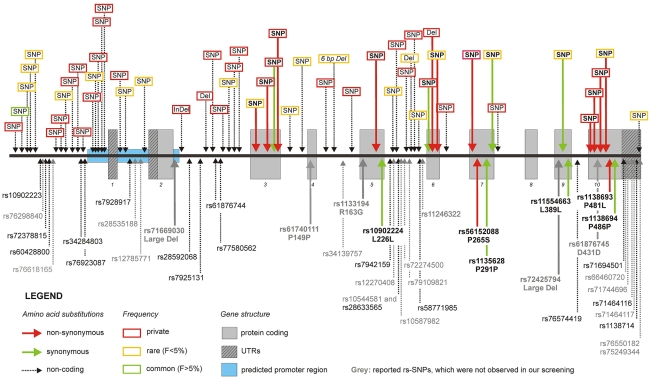
Figure 2. Frequency, type, and localization of all novel variants.
The upper part of the figure shows the novel variants, while the lower part depicts previously known SNPs according to dbSNP build 131. Details about the meaning of the color codes and arrow types are given in the legend within the figure. Nearly all genetic variants were rare (yellow boxes) or even private (red boxes).

