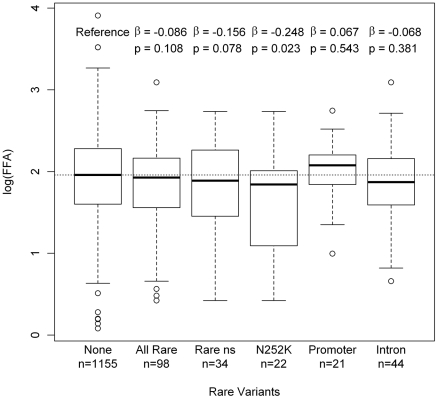
Figure 5. Boxplots on log(FFA) for different classes of rare variants.
The figure shows the free fatty acid (FFA) distribution of the carriers of different subgroups of rare variants (all rare variant carriers, carriers of rare non-synonymous mutations, carriers of p.N252K, carriers of variants of rare promoter SNPs (defined as SNPs upstream of ATGL or within the predicted promoters structures in intron 1, see also Figure 2) and carriers of rare intronic SNPs) compared to individuals without rare variants (labeled with „none“). Variants in ATGL showed a tendency towards lower FFA levels, which was most pronounced for the p.N252K group. Conversely, a tendency towards higher FFA levels was observed for variants in the putative promoter region. Estimates and p-values were calculated by linear regression on the logarithmized FFA levels (expressed as mg/dl).

