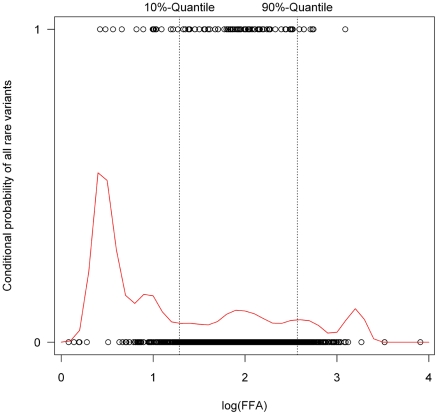
Figure 6. Conditional density plot showing the probability of carrying a rare variant conditional on free fatty acid (FFA) plasma concentrations.
The dots at the upper, respectively lower border of the plot depict the log(FFA) value (given on the X-axis) of each proband with (upper dots) or without (lower dots) rare variants. Based on the observed distribution, the curve gives the probability of carrying a rare variant conditional on FFA values. This was clearly higher in the lower 10% quantile, indicating an accumulation of rare variants in the lower 10% quantile. The position of the upper and lower 10% quantiles of the log(FFA) in the screened samples are marked by the dotted lines.

