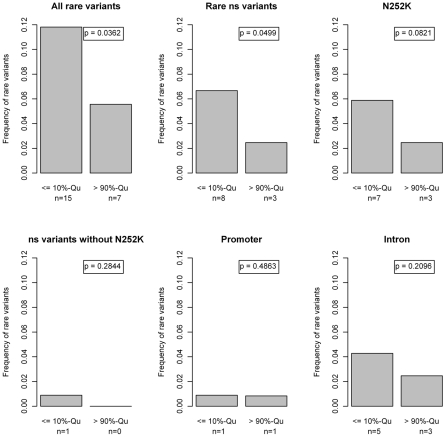
Figure 7. Barplots and beta tests comparing the first and last 10%-quantiles of the free fatty acid (FFA) distribution.
Differences in the proportion of rare variant carriers between the lower and the upper 10% quantiles of the FFA levels. We observed an accumulation of rare variants in the lower 10% quantile, which was mainly driven by the p.N252K variant with a contribution of rare intronic variants. No accumulation of other missense variants or promoter variants was observed. Statistical significance was assessed with the Beta-Test proposed by Li et al [44]. “ns”: non-synonymous.

