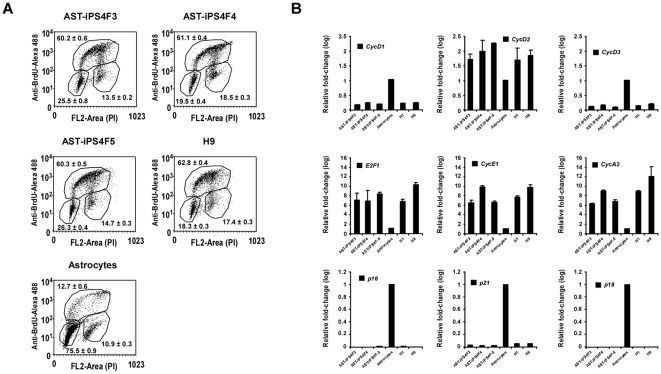
Figure 3. ASThiPS cells acquired the stem cell cycle signature observed in hES cells.
(A) BrdU incorporation analyzed by flow cytometry in ASThiPS cell lines, astrocytes and H9 cells. Represented in each dot plot are the percentages of cells in G1 phase (population in the lower left corner), S phase (upper region) and G2 phase (population in the lower right corner). 10,000 cells were represented in each dot plot and the averages ± SEM were calculated from two biological replicates analyzed in triplicate. (B) Analysis of the indicated cell cycle genes, by real-time PCR in ASThiPS cell lines, the parental cells of origin and hES cells. Data in are shown as relative average fold change ± SEM from two biological replicates analyzed in triplicate.

