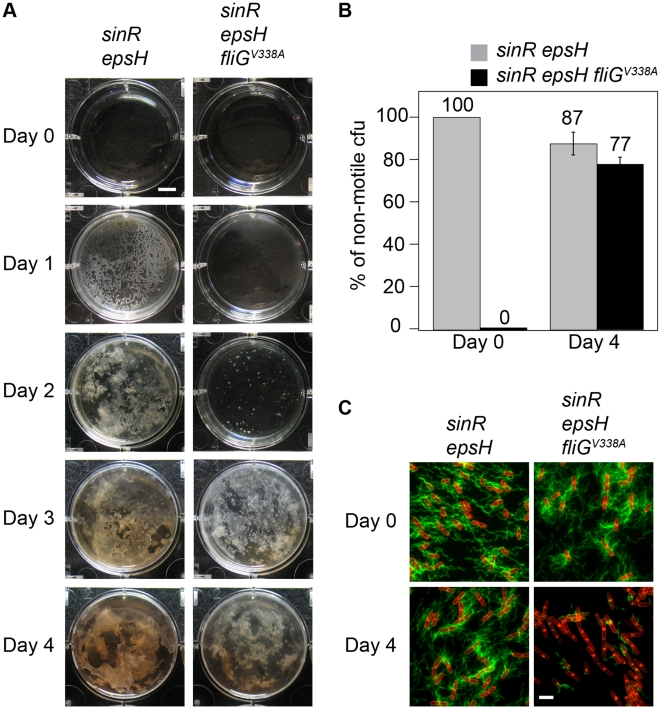
Figure 5. Motility inhibition enhances biofilm formation.
A) The pellicle images are top views of DS1674 (sinR epsH) and DS4532 (sinR epsH fliGV338A) grown at 25°C for the indicated time period. B) The graph represents the percentage of isolated colonies from the indicated strains that were non-motile when dilution plated on Day 0 and Day 4. Error bars are the standard deviation of three replicates. C) Fluorescent micrographs of the parent strains and isolates from 4 days of growth stained with FM4-64 (membrane, false colored red) and Alexa Fluor C5 488 maleimide (flagella, false color green). All strains express the modified flagellar filament protein HagT209C. The following strains were used to generate this figure: sinR epsH (DS2179), sinR epsH fliGV338A (DS7289), sinR epsH 4 day isolate (DS7290), and sinR epsH fliGV338A saf non-motile isolate (DS7293). Scale bar equals 2µm.

