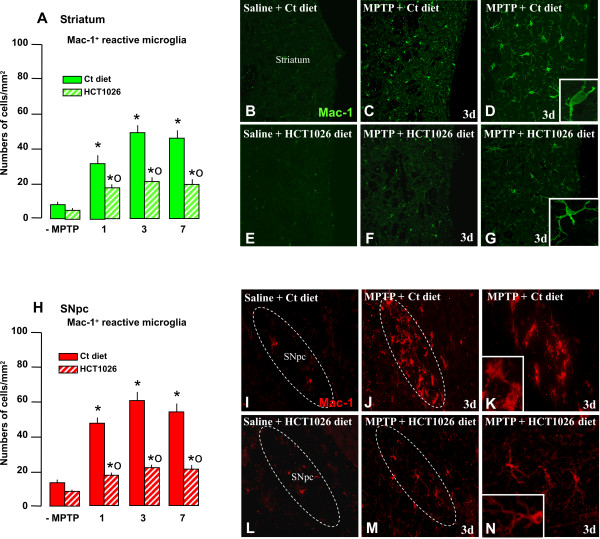
Figure 6.
HCT1026 inhibits MPTP-induced increased reactive Mac-1+ microglia in striatum and SNpc. Ageing (9-11 month-old) C57Bl/6 mice fed with a control (ct) or HCT1026 diets (30 mg kg-1) starting at -10 d, underwent an MPTP treatment, as described. At different time-intervals mice were anesthetized and rapidly perfused, the brains processed for immunohistochemistry. Coronal sections at the level of the striatum and SNpc were stained with Mac-1-Ab to localize microglial cells. A-B: Reactive (ameboid-like) microglial cells were counted at different time-intervals after saline and MPTP injection (n = 4/experimental group) in mice fed with a ct or HCT1026 diets, within both Str (A-G) and SNpc (H-N). Differences were analyzed by ANOVA followed by Newman-Keuls test, and considered significant when p < 0.05. **p < 0.05 vs saline; *° p < 0.05 vs MPTP mice fed with ct diet. B-E: Representative confocal images of Mac-1 staining (green) in saline (B), 3 d after MPTP in mice fed with ct diet (C, 20× and D, 40×) or HCT1026 (F, 20× and G, 40×). Insets (100×) show microglia morphologic appearance. I-N: Representative confocal images of Mac-1 staining (red) in SNpc. Note the high density of reactive Mac-1+ cells with rounded cell bodies and short, thick processes 3 d after MPTP administration in mice fed with a ct diet (J-K), as compared to Mac-1 microglia of mice fed with HCT1026 (M-N), exhibiting a more elongated cell body and long ramified processes.

