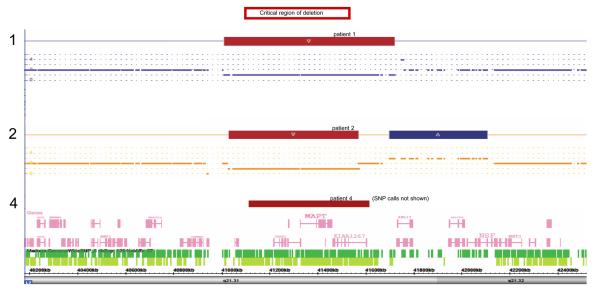
Figure 2.
Diagram of the 17q21.31 locus, with the deletions in patients 1, 2 and 4 shown. Red indicates deleted material, whilst blue is adjacent duplicated material in patient 2, in this region rich in copy number variants. The critical region for the deletion phenotype is shown at the top of the figure.

