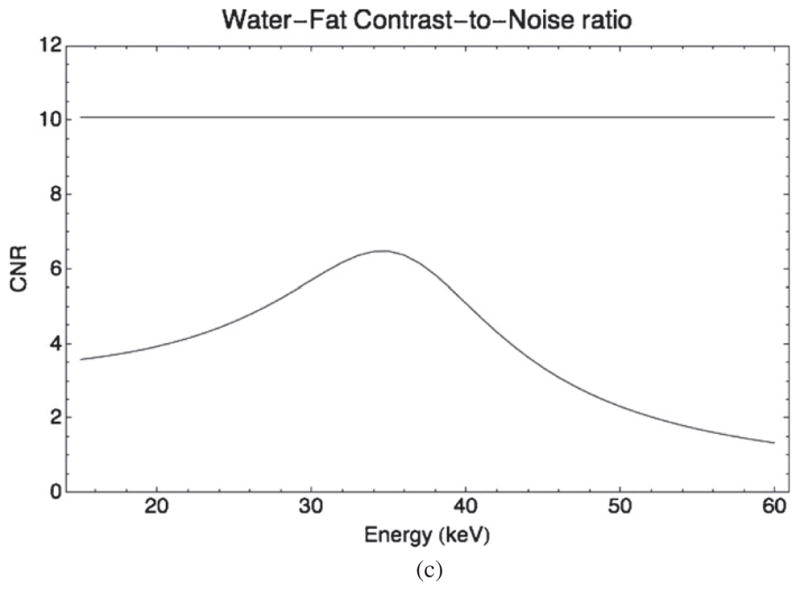
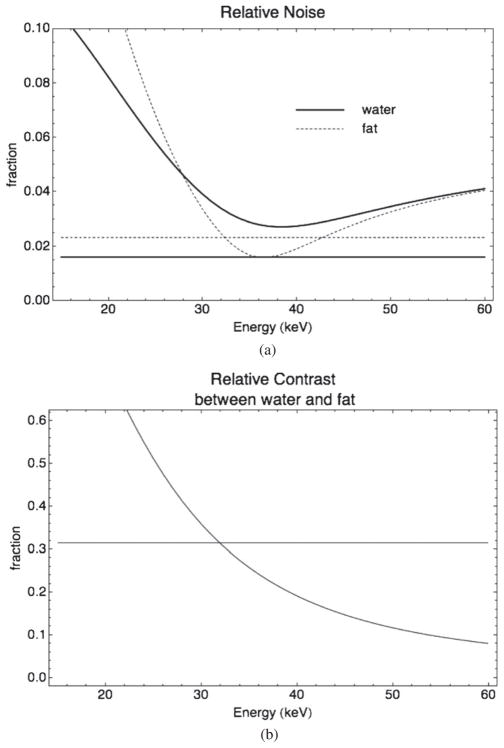
Figure 5.

(a) Relative noise in fat (dashed lines) and water (solid lines) regions as a function of energy for the DE scan (curves) compared to the reference 70 kVp (straight lines). (b) Relative contrast between fat and water regions as a function of energy for the DE scan (curve) compared to the reference 70 kVp (straight line). (c) Contrast-to-noise ratio of water over fat as a function of energy for the DE scan (curve) compared to the reference 70 kVp (straight line).

