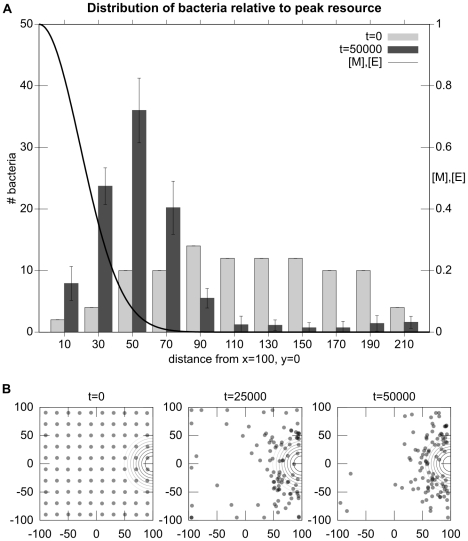
Figure 6. Experiment 1: Chemotaxis towards a gradient of  and
and  .
.
Plot A is a histogram that indicates the distance of bacteria from the location of highest concentration of  and
and  (
( ) at the start and end of trials. Data are averaged from 10 runs of 100 bacteria each. Plot B indicates the spatial distribution of the simulated bacteria as time progresses in a typical trial. The concentric circles indicate the center of the Gaussian distribution of resources
  and
and  .
.

